

Understanding city emissions when data are limited
Published: 16 Feb 2022
Mitigation
The first step to reduce future urban greenhouse emissions is to understand what cities are currently emitting and where these emissions are coming from. But how can this be done in cities where data are limited? The proxy data tool developed as part of CoM SSA might be just what cities need.
Cities worldwide are feeling increasing pressure to lower their emissions to assist national governments in meeting international targets and commitments, like the Paris Agreement and the more recent Glasgow Climate Pact. In the preamble of these internationally binding treaties, subnational governments are specifically called upon and deemed essential in reducing emissions.
With the Covenant of Mayors in Sub-Saharan Africa’s (CoM SSA) support, cities develop their climate plans and turn them into concrete actions to bring long-term sustainable urban development. In this essential stage of developing a climate plan, GIZ and its local partner ICLEI Africa are working with urban leaders in four African cities to determine their current and projected emissions and set realistic and achievable targets as well as practical targets actions to achieve them. These targets and actions are captured in a Sustainable Energy Access and Climate Action Plan (SEACAP), the first section of which requires a city to deeply understand and shift their emissions trajectory. Yet, in many African cities, towns, and municipalities, the officials required to take action face a critical challenge: they do not have the data they need to understand the current emissions, let alone make projections and plans for the future.
Why African cities and regions struggle to report their emissions
In Africa as a whole, data is always hard to come by. This is due to many reasons, one of them being the burgeoning informality. While it adds vibrancy and uniqueness to our cities, it also makes it challenging to record and update data at the city level. In many cases, city boundaries are not clearly defined, or there exist different boundary lines for different circumstances. Adding to this, officials might be reluctant to undergo challenging data collection activities if they cannot clearly see how reporting emissions will support their existing mandates or feed into the policies that pertain to them.
Another reason why sub-Saharan African cities struggle to report their emissions is because available data speak to national level sectors are inconsistent with how the cities, regions, counties or municipalities define their sectors at the subnational level. National data can be difficult to come by unless it is made publicly available, and hard to scale down to city level, especially if a country is predominantly rural, but the cities are urban or industrial.
Understanding city emissions through the Proxy Data Tool
The Proxy Data Tool assists cities with developing their Baseline Emissions Inventory (BEI) to ultimately understand their current emissions. It provides cities with an estimation of emissions based on the population by downscaling national data, in addition to a high-level overview of the city’s emissions and what they could look like in the decades to come. If local data do exist, the proxy data tool can also be used in combination with these data to make a more accurate estimation of the emissions profile. For example, if there is local information available for the transport sector, but not for the energy or waste sectors, the Proxy data Tool can use local information for transport and proxy data for the other sectors.
Estimating emissions in Bobo-Dioulasso and Nakuru County
As is typically the case in urban Africa, not much city-specific data was available for Bobo-Dioulasso in Burkina Faso when they started developing their BEI. The Proxy Data Tool allowed the city to downscale the bulk of waste and energy data for almost all sub-sectors from national data using the population of the city and international reports. For transport, a combination of provincial-level data and local data were available, which was downscaled where appropriate for the city. The combination of both methods allowed Bobo-Dioulasso to understand its emissions profile using this tool: 42% of the city’s emissions come from the energy sector, 33% come from the transport sector, and 25% come from the waste sector. If no action is taken, Bobo-Dioulasso’s emissions will likely triple in the next decade. With this in mind, the city aims to reduce its overall projected emissions by 10% by 2030, which is in line with Burkina Faso’s Nationally Determined Contribution (NDC).
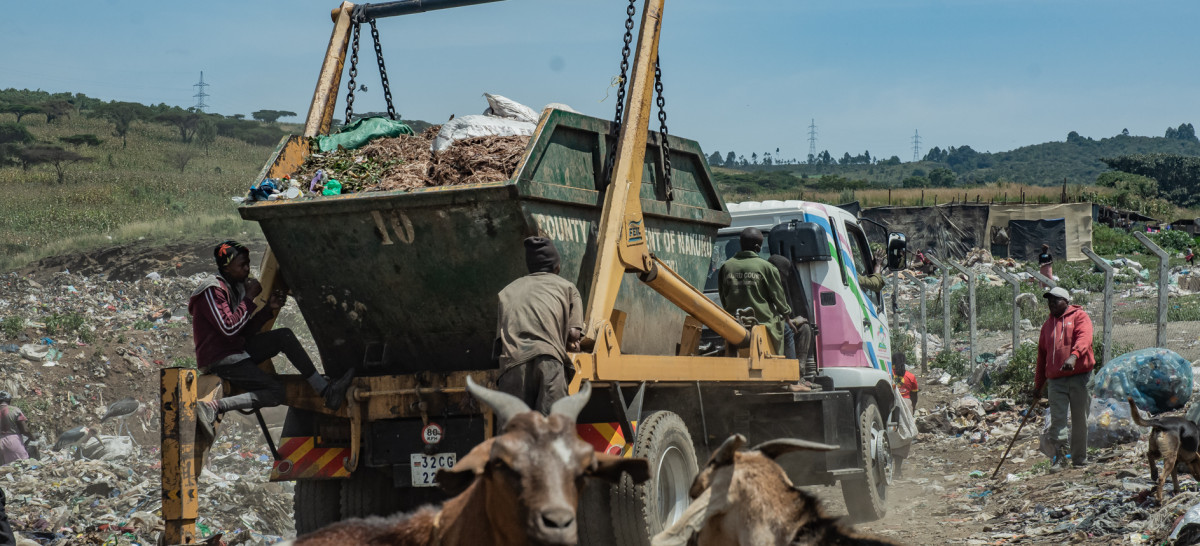
In contrast, more local data was available in Nakuru County (Kenya), although not complete for all sectors. The Proxy Data tool allowed for the local data to be used along with a combination of international data, national census data, national data on transport and energy use, as well as household data on energy use, and waste gathered through a survey specifically undertaken in Nakuru County resulting in a clear profile emerging for the County. As a result, Nakuru County was able to see that the largest contributing emissions producing sector is stationary energy (43%), followed by transport (33%) and waste (24%). The BEI also flags that Nakuru County’s emissions will rise by 65% by 2030 if no action is taken, which spurred Nakuru County to commit to reducing their GHG emissions by 33% by 2030.
Related Articles
-
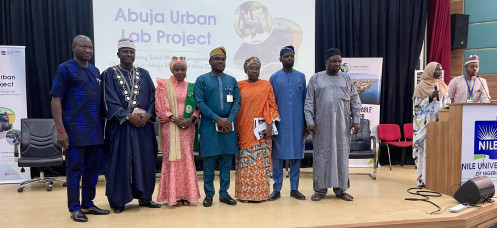
Press Release | Successful Launch of Abuja Urban Lab Transforms Waste Governance in the City
Abuja, December 13, 2023 – In a ground-breaking move towards sustainable urban development, the Nile University, in partnership with the Covenant of Mayors in Sub-Saharan Africa (CoM SSA) co-implementing partner, the Deutsche Gesellschaft für Internationale Zusammenarbeit (GIZ), successfully unveiled the Urban Lab initiative to establish an efficient waste management system in the Abuja Municipal Area Council. This initiative also seeks to enhance community awareness about waste issues and promote environmental sustainability through strategic partnerships and innovative waste management solutions.
View articles -
Genuine collaboration critical for African cities to combat devastating climate change
We need to take a long, hard look at the state of our planet and map a better course for our future. We need genuine collaboration, true inclusivity and authentic commitment to decrease the significant gap between promises and climate action. The recent Africa Climate Summit and UNFCCC Africa Climate Week, together with the Global Stocktake Report, highlighted that there is an urgent need to scale up a rigorous all-of-economy, all-of-society approach which leads to significant climate action this decade in order to limit global warming to 1.5°C.
View articles -
The Maputo Metropolitan Area launches a joint Sustainable Energy Access and Climate Action Plan
The Municipalities of Maputo, Matola and Boane have developed a firm commitment to carry out the actions defined by their newly developed climate action plan, as was evident in September 2023 when the plan was officially launched.
View articles